Moving beyond vanity metrics is the key to a strong finish. This guide covers the software development KPIs that help technical leaders protect focus time and reduce rework.


.svg)
.svg)
The end of the third quarter is a unique time in the technology sector. It is the bridge between the ambitious planning of the early year and the high pressure execution of the final months. For many leaders, this is when the reality of the roadmap starts to clash with the available resources. If you are leading an engineering organization, your stakeholders are likely looking for clarity on progress, efficiency, and the bottom line. However, the way we define success in engineering has shifted significantly in recent years. We have moved past the era where simple volume was the primary indicator of health. As you sit down for your Q3 engineering performance review, you need a set of numbers that tell a deeper story than just how many features were shipped. You need a framework that accounts for modern challenges like AI assisted coding, distributed teams, and the increasing complexity of cloud native architectures. To finish the year with momentum, you must reassess your software development KPIs to ensure they actually reflect the value your team is creating for the business.
In the past, many leaders relied on throughput metrics like the number of commits or the volume of tickets closed. In the modern landscape, these figures can be incredibly misleading. With the rise of AI coding assistants and sophisticated automation, generating code has become easier than ever. The real challenge is no longer just writing code; it is ensuring that the code is meaningful, maintainable, and solving the right problems.
When you evaluate developer productivity metrics this quarter, you should look specifically at the ratio of code created to code deleted. A healthy, maturing codebase often involves significant refactoring. If your team is only adding new lines without ever cleaning up the old ones, you are likely accumulating a level of technical debt that will haunt your Q4 releases. High performing teams are often those that find ways to simplify the system rather than just making it larger.
Another critical area to reassess is the impact of AI on your workflow. It is not enough to say that your engineers are 20 percent faster because they use AI tools. You need to look at the rework rate of that AI generated code. If the speed gain at the keyboard leads to a massive spike in bugs during the QA phase, you have simply shifted the bottleneck further down the line. True productivity is measured by how quickly a high quality feature reaches the end user, not how fast a pull request is opened.
One of the most important roles of a technical leader is to act as a bridge between the engineering department and the finance office. To do this effectively, you need to categorize where your human capital is actually going. Every team has a limited amount of engineering hours in a quarter. If you do not track the allocation of these hours, you cannot make informed strategic decisions.
Your engineering metrics for CTOs should provide a clear breakdown of four major categories:
By the time you reach the end of Q3, it is common for the operational maintenance category to start eating into the new innovation budget. This often happens silently. Without a clear metric, you might not realize that your team is spending 60 percent of their time just keeping the lights on. Use this reassessment to rebalance the scales. If the maintenance load is too high, it might be time to pause new features and focus on the underlying stability of the platform so you can start the new year on solid ground.
When you present these metrics to the rest of the leadership team, remember to translate technical health into business outcomes. The board does not necessarily need to know your exact cycle time in minutes, but they do need to know how that cycle time affects the time to market for new products.
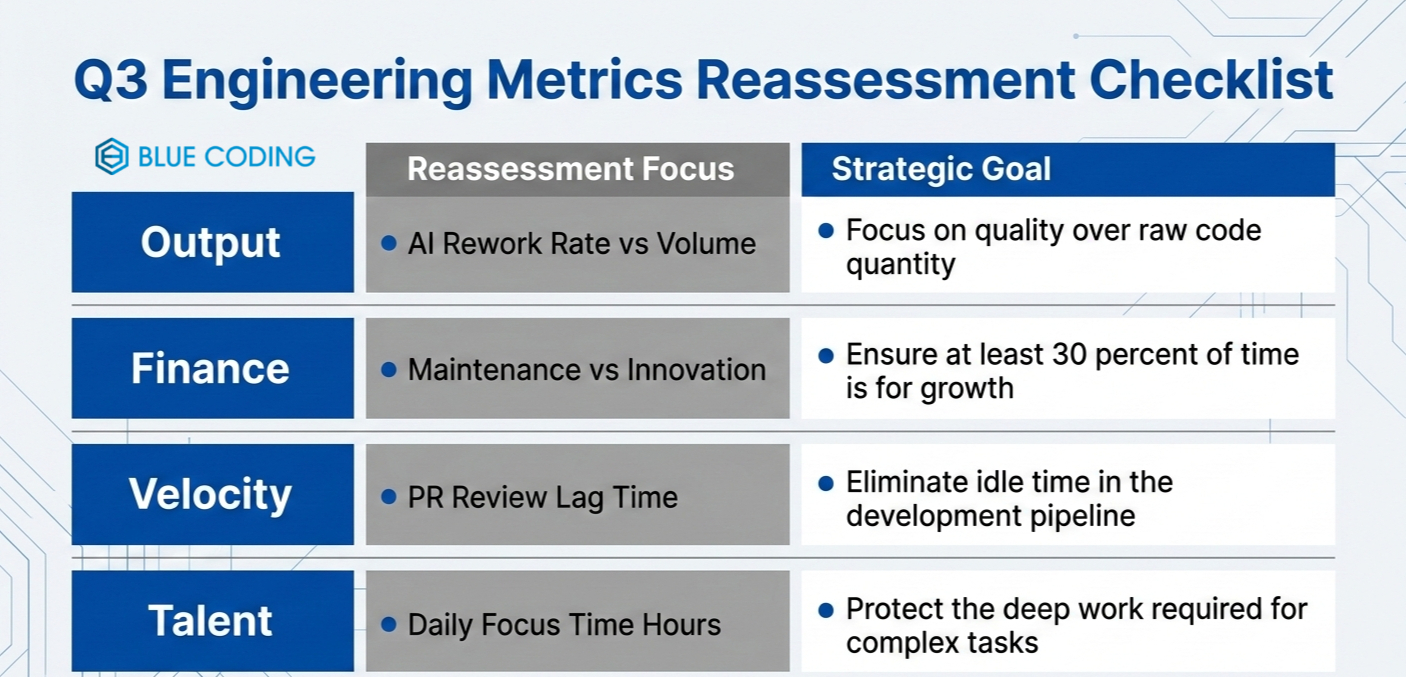
Cycle time remains one of the most reliable software development KPIs available, but only if you break it down into its component parts. Looking at the total time from start to finish is a good high level health check, but it does not tell you where the friction is. To close Q3 strong, you need to look at the segments where work sits idle. The most common bottleneck in modern engineering is the review and approval phase. In many organizations, a developer might finish a task in four hours, only for it to sit in a peer review queue for two days. This delay is a silent killer of momentum. It leads to context switching, where the developer moves on to a new task and then has to mentally reload the old one when feedback finally arrives.
Analyze your Time to First Review and your PR Size. Small, frequent updates are much easier to review and test than massive, monolithic pull requests. If your metrics show that your average PR takes more than 24 hours to get its first comment, your team has a collaboration problem, not a coding problem. Addressing this now can significantly increase your velocity for the end of year push without adding any additional headcount.
We often treat developer time as a commodity that can be sliced into thirty minute blocks, but engineering requires deep concentration. Every time a developer is interrupted by a meeting, a Slack notification, or a non-urgent request, they lose a significant amount of cognitive energy. As you conduct your Q3 engineering performance review, look at the focus time available to your engineers. Focus time is defined as a block of at least two hours without interruptions. Data shows that the most productive engineering teams protect these blocks religiously. If your metrics show that your developers are only getting one or two of these blocks per day, it explains why your roadmap is slipping.
Modern developer productivity metrics should track the density of the calendar. As a leader, your job is to clear the path. This might mean implementing no meeting days or moving more communication to asynchronous formats. Protecting the mental space of your team is one of the highest leverage moves you can make to ensure a strong finish to the year.
The final area to reassess is the quality of your deployments. Many teams track the change failure rate, which measures how often a release causes a major incident. While this is important, it only catches the most catastrophic issues. To get a more nuanced view, look at the Deployment Rework Rate. This metric tracks how many releases require a follow up patch or a fix within a short window, even if the site did not go down. A high rework rate suggests that your testing environment is not matching production or that your automated tests are failing to catch subtle regressions. If you are constantly shipping fixes for your fixes, you are burning valuable engineering time that could be used for new features. To improve these engineering metrics for CTOs, focus on the robustness of your CI and CD pipelines. Investing in automated regression testing and better staging environments in Q3 will pay massive dividends in Q4 when the pressure to release increases and the tolerance for errors decreases.
Closing Q3 with a strong set of data allows you to lead with confidence. It moves the conversation away from gut feelings and toward objective reality. By reassessing these metrics now, you can identify the hidden bottlenecks that are slowing your team down and fix them before they derail your end of year goals.
At Blue Coding, we believe that great engineering leadership is about more than just managing a backlog. It is about building a system where talent can thrive and where every hour of effort translates into real world value. This is why we focus on helping companies align their technical DNA with their business objectives. If you are looking to audit your current performance or need a fresh perspective on your engineering strategy, we offer complimentary discovery calls. It is a zero pressure way to sit down with our team, talk through your specific challenges, and see how we can help you clear the path for your developers. Contact us now and book your call!


Subscribe to our blog and get the latest articles, insights, and industry updates delivered straight to your inbox